Tax Treaties Explorer
Tax treaties are agreements between states that divide up the right to tax cross-border income. In negotiating tax treaties, developing economies have often given up a significant amount of their taxing rights. The International Centre for Tax and Development has simplified the complex landscape of tax treaties to enable audiences to easily access and compare the data. However, as a complex database, accessible only through a spreadsheet, it was difficult for users to extract context or draw conclusions.
ICTD wanted a tool that would enable and encourage users to explore and make sense of the data without being legal experts and professional designers. We created a data visualisation tool that would enable high-level comparison of tax treaties through a range of views and time-frames at the individual country level or in groups such as region, income and organisational levels (ASEAN, BRICS, OECD, etc). Through this, a wide range of audiences will be able to understand and share the data necessary to demonstrate clear trends, useful comparisons and make informed decisions.
Making sense of the data
Tax treaties are hugely variable and while they do share similarities, these are not always easily comparable and measurable. In an effort to make these treaties more transparent and enable countries to improve upon their own historical agreements as well as those of others, the data was simplified to showcase trends and variation easily and clearly.
ICTD coded for 28 different clauses, reflecting some of the key areas of negotiation, with a set of indices giving average values for the overall balance of a treaty and for a subset of clauses (withholding taxes, permanent establishment, and others). This was an enormous amount of data that, contained in a spreadsheet, would be difficult to engage with. The explorer was designed to help users navigate through and find the specific details they needed.
Viewing the treaties
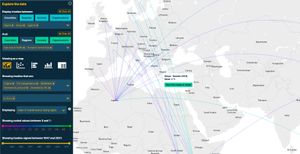
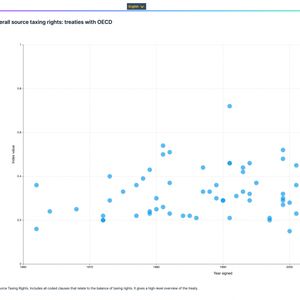
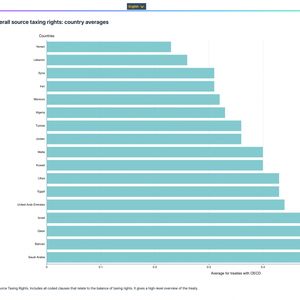
Given the range of data users are able to explore, it was critical that the data could be expressed in multiple formats to effectively display variation. While initially the scatterplot and bar charts were seen as the highest priority, as we explored the options to view the data, it became apparent that each view provided sufficiently varied visualisation to be considered indispensable.
The site provides a map, scatterplot, 2 bar charts and a table in addition to being able to view individual treaties in detail and download the full dataset.
Sharing the data
Intended to help campaigners, economic and legal researchers, government officials, journalists, policy makers and government officials to understand and improve upon tax treaties, sharing the results was critical. Enabling users to share links to the specific visualisations they had created or to download images for reports and presentations meant a specific subset of data could easily be communicated, replicated and edited as necessary.
To allow wider use, the site is currently available in English and French with the capacity to introduce additional languages in future development